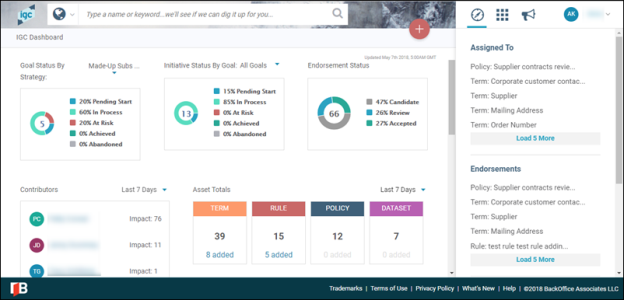
IGC™ Dashboard
You can view a dashboard with IGC™ centric metrics and information. You must have permissions to the Director persona in Admin to access the dashboard. Refer to Add a User for more information. Once you have Persona set to Director, the dashboard is displayed as soon as you log in.
NOTE: The dashboard is generally updated once daily, but can be updated more frequently. Refer to the date and time stamp in the upper right corner of the dashboard to see when it was last updated.
To navigate the dashboard:
-
To leave the dashboard and access another component, for example, Strategy or Admin, click the icon in the Applications panel.
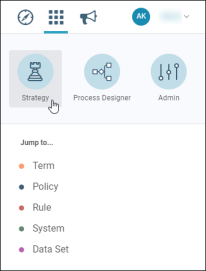
- To return to the dashboard from anywhere in the IGC™, click the IGC (
 ) logo.
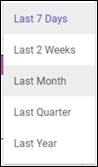
Where available, you can use the timeframe drop-down to update the date range of the metrics displayed in the dashboard charts and tables.
Strategy Metrics
The Strategy Metrics charts allow you to view the status of the assets in the IGC™. This can provide you with an indicator of how well the company or program is doing in achieving its goals and initiatives.
On the status charts, you can click a status legend to remove it from the total and percentages. Click the legend again to include it.
Use the scroll options as needed to scroll and display the full list of statuses.
You can hover over the descriptions in the chart titles to show the complete description.
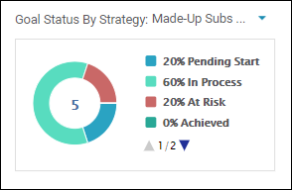
Goals Status by Strategy
You can view a percentage-based summary of the statuses of goals within a strategy.
You can select the Strategy drop-down to change the chart to show company or program metrics. Refer to Strategy for more information about company and program strategies.
In the following example, you can see that 20% of the company-level goals are in a status of “At Risk.”
You can click the number in the center of the chart to view the Goals for the company or program selected.
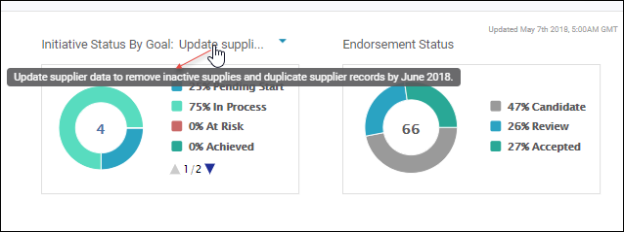
Initiative Status by Goal
You can view a percentage-based summary of the statuses of Initiatives by Goal. This chart contains metrics for all goals across all programs.
You select a goal from the drop-down to see the statuses for the Initiatives related to the goal. In the following example, you can see that 67% of the initiatives related to the selected goal are in progress.
![]()
You can click the number in the center of the chart to view the Initiatives.
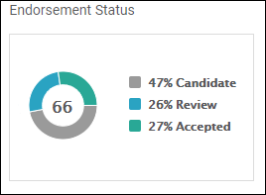
Endorsement Status
The Endorsement Status chart provides a percentage-based summary of where a company’s assets are within the endorsement workflow process.
The number in the center of the Endorsement Status chart is the total number of assets in IGC™ that can be endorsed (Terms + Rules + Policies).
The percentages represent the percent of each endorsement status that exists.
In this chart you can view the following metrics:
- % of Assets in “Candidate” endorsement status
- % of Assets in “Review” endorsement status
- % of Assets in “Accepted” endorsement status
In the following example, you can see that there are 66 total assets and 27% of those assets have been accepted.
Asset Totals
You can view the total number of each type of asset that is being governed in the IGC™. You can view the number of new assets by asset type that have been added during a selected period of time.
In the following example, you can see that of the 12453 terms that are defined, 120 were added in the last seven days.
NOTE: While the rest of the dashboard data and the number of added assets is not updated in real time, the Asset Totals counts are updated in real time.
NOTE: The asset added counts include assets that were added and subsequently deleted in the timeframe selected.
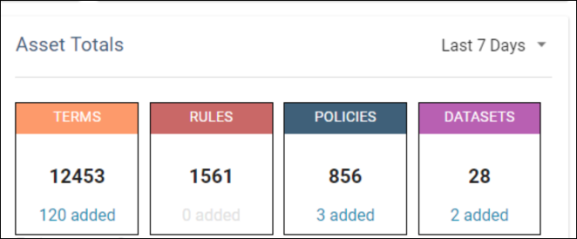
The color code scheme in the headers for the Asset Totals section of the dashboard matches the schema used in the Search Results page and Jump to… options.
You can click the link for the added assets to view the new assets on the Search Results page and from there you can open the detail for an asset. If you open an added asset's detail page, and then navigate back to the search results page, the search criteria is cleared and all assets in IGC™ are displayed.
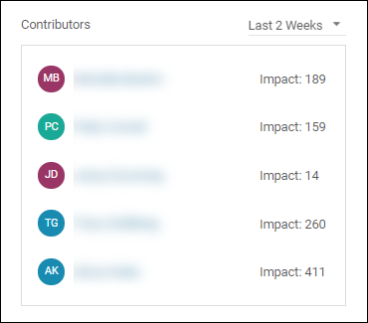
Contributors
You can view an impact status value for contributors in the IGC™. The contributor’s impact status is calculated based on the sum of created assets and sum of the number of changes a contributor has made to assets.
This information allows you to gauge the impact contributors are making on the governance strategy.
The chart is sorted in alphabetical order by the last name of the contributor.
Recent Highlights
Here you can view assets that were recently Accepted or Contested. The Recent Highlights table is sorted in descending order from latest to earliest.
You can click an asset in the list to open the asset’s detail page.